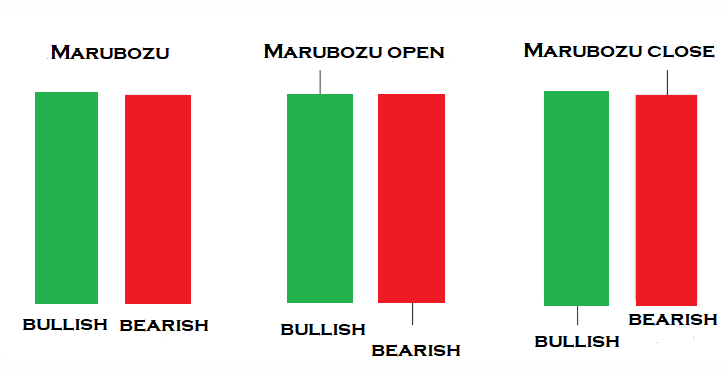
Begin your article by briefly introducing the Marubozu candle, a powerful tool in technical analysis used by traders to make informed decisions. Explain its importance in understanding market sentiment and forecasting potential price movements.
The Anatomy of a Marubozu Candle
The anatomy of a Marubozu candle is straightforward yet highly informative, making it a valuable asset for traders who understand how to interpret its signals. A Marubozu candle is a type of candlestick pattern found in technical analysis that provides insight into market sentiment during a given time period. Here’s what makes up the anatomy of a Marubozu candle:
Solid Body
The most prominent feature of a Marubozu candle is its large, solid body. Unlike other candlestick patterns that might have wicks or shadows indicating price rejections or ranges outside the opening and closing prices, the Marubozu candle shows a clear and decisive move in one direction. The body of the candle represents the price range between the open and close of the market for that period.


No Wicks
A pure Marubozu candle has no wicks or shadows extending from the top or bottom of its body, indicating that the price did not deviate beyond the range established by the opening and closing prices. This lack of wicks is what sets the Marubozu candle apart from other patterns and signals strong buying or selling pressure throughout the trading session.
Color Significance
The color of the Marubozu candle’s body is crucial for interpretation:
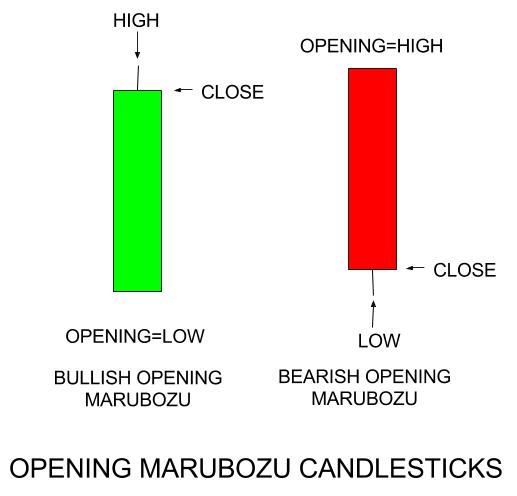
- A black or red Marubozu indicates that the candle is bearish. It opens at the high and closes at the low, showing that sellers controlled the price action from the opening bell to the close without any pullback.
- A white or green Marubozu suggests bullish sentiment. It opens at the low and closes at the high, indicating that buyers were in full control throughout the entire trading session, pushing prices up with no retracement.
Bullish and Bearish Variants
- Bullish Marubozu: This variant signals strong buying interest. Traders interpret this as a potentially continued upward trend, especially if it occurs after a period of consolidation or at the start of an uptrend.
- Bearish Marubozu: Conversely, the bearish Marubozu indicates strong selling pressure. It could be a precursor to a downtrend or a signal of a significant reversal if it appears after a period of bullish momentum.
Trading Implications


The appearance of a Marubozu candle on a chart can have significant trading implications. For bullish Marubozu candles, traders might consider entering long positions or adding to existing ones, anticipating further upward movement. For bearish Marubozu, it could be a signal to exit long positions or initiate short trades, expecting the price to decline further.
Types of Marubozu Candles
Marubozu candles are pivotal components of candlestick charting, and understanding the types of Marubozu candles is essential for traders looking to harness their full potential in market analysis. There are two primary types of Marubozu candles, each signaling different market sentiments: the Bullish Marubozu and the Bearish Marubozu. Here’s a detailed look at both:
Bullish Marubozu
A Bullish Marubozu candle is characterized by a long, solid body without any wicks or shadows, indicating that the price closed significantly higher than it opened. This type of Marubozu is typically green or white, signifying strong buying pressure throughout the trading period. The absence of shadows suggests that buyers maintained control from the opening to the closing bell, pushing prices upward without significant resistance from sellers.
Key Characteristics:
- Open Price: At the low of the period.
- Close Price: At the high of the period.
- Market Implication: Indicates strong bullish sentiment and may signal the start of an uptrend or continuation of a current bullish trend.
Bearish Marubozu
Conversely, a Bearish Marubozu candle is identified by its long, solid body without any wicks, indicating that the price closed much lower than it opened. This type of Marubozu is typically red or black, highlighting strong selling pressure throughout the session. The lack of shadows indicates that sellers dominated the trading period from start to finish, driving prices down without significant buying resistance.
Key Characteristics:
- Open Price: At the high of the period.
- Close Price: At the low of the period.
- Market Implication: Suggests strong bearish sentiment and could signal the beginning of a downtrend or the continuation of a downward movement.
For my contact:
You should first send me a friend request on MQL5, this will make it easier for me to connect and best support you with technical issues: https://www.mql5.com/en/users/tuanthang
– Join our Telegram Channel for new updating: https://t.me/forexeatradingchannel
– Recommended ECN Broker for EA – Tickmill: https://bit.ly/AdvancedTickmill
– Recommended Cent/Micro Account Broker for EA – Roboforex: https://bit.ly/AdvancedRoboforex
– To use an EA you need a VPS. Recommended VPS for EA
– Chocoping: https://bit.ly/AdvancedVPS. When you open the account type in the discount code to get 10% off: THANGEA10
– If you want to ask me any question or join our private group chat for traders. Please contact me through Telegram: https://t.me/thangforex


