

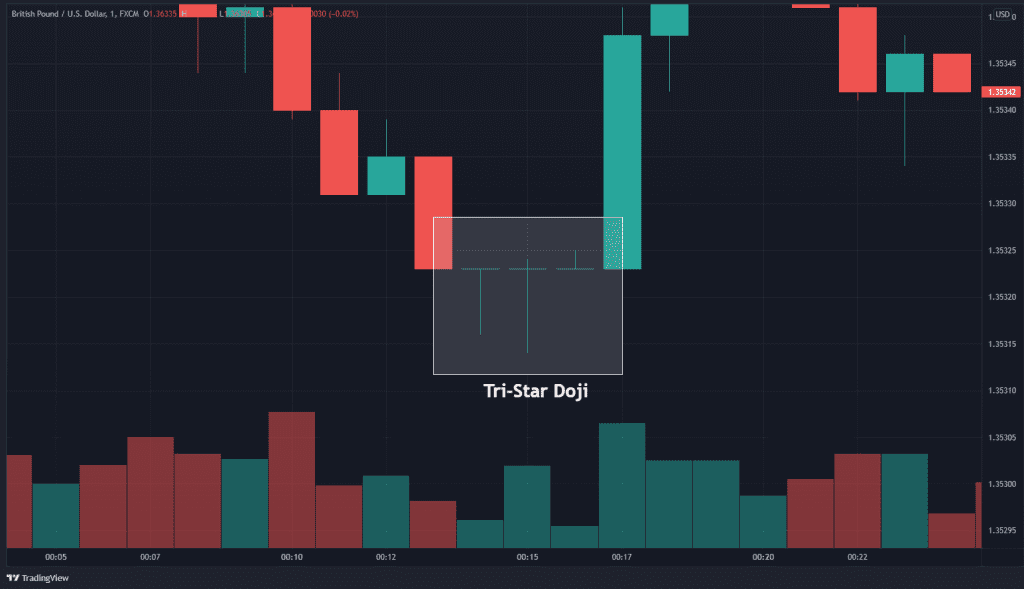
The 3 Doji pattern is a fascinating phenomenon in technical analysis and candlestick charting, offering traders and investors insight into market sentiment and potential shifts in direction. This pattern comprises three consecutive Doji candles, each a representation of equilibrium between buyers and sellers, indicating a period of indecision or consolidation in the market. Understanding the intricacies of this pattern can provide a significant edge in navigating the complexities of trading.
What is a Doji?

At the heart of the 3 Doji pattern is the Doji candle itself. A Doji occurs when a security’s open and close prices are nearly identical, resulting in a candlestick that looks like a cross, plus sign, or thin line. This similarity in opening and closing prices signifies a tug-of-war between buyers and sellers, with neither side gaining significant ground during the trading session.
Significance of the 3 Doji Pattern
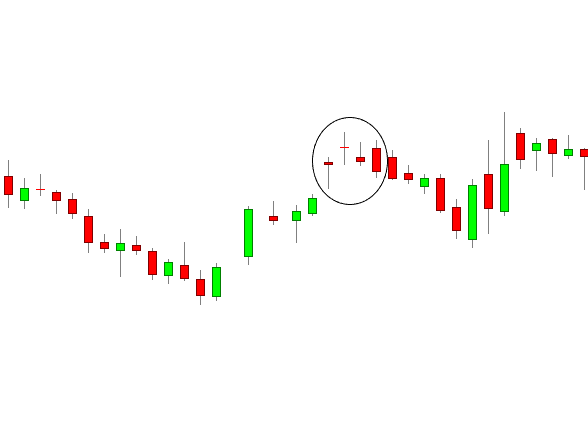
The appearance of a single Doji candle can suggest a moment of hesitation in the market, but when three Doji candles appear consecutively, it underscores a significant level of indecision among participants. This pattern is particularly noteworthy because it suggests that a market, previously moving in a clear direction, is now uncertain. This uncertainty can precede a reversal, as the equilibrium signals that the momentum driving the current trend is waning.
Interpreting
- Indication of a Potential Reversal: The primary interpretation of the 3 Doji pattern is as a precursor to a market reversal. After a strong uptrend or downtrend, this pattern indicates that the forces of supply and demand are becoming balanced, potentially leading to a change in direction.
- Confirmation Required: While the 3 Doji pattern signals indecision, smart traders look for additional confirmation before making a move. This confirmation could come from subsequent candles showing a clear trend or other indicators such as volume, moving averages, or momentum oscillators.
- Context Matters: The significance of the 3 Doji pattern can vary depending on the market context in which it appears. For example, after a prolonged trend, its appearance might be more meaningful compared to its occurrence in a sideways or ranging market.
Trading Strategies Based
To effectively leverage the 3 Doji pattern, traders often wait for further confirmation following its appearance. This could involve:
- Observing for a breakout candle that moves beyond the range of the Doji candles, indicating the direction of the potential reversal.
- Utilizing other technical analysis tools, such as trend lines or moving averages, to confirm the reversal signal.
- Setting stop-loss orders just beyond the Doji pattern to manage risk, should the expected reversal not materialize.
Why It Matters
Traders value the 3 Doji pattern for its ability to signal a pause in the prevailing trend, indicating that a reversal may be on the horizon. Recognizing this pattern allows traders to make informed decisions, potentially leading to profitable outcomes.
Strategizing
Implementing the 3 Doji pattern into your trading strategy involves keen observation and timing. It’s crucial to consider additional market indicators to confirm the pattern’s implications and refine your entry and exit points.
FAQ
- What does a Doji represent?
A Doji indicates market indecision, where the forces of supply and demand are balanced. - How can I identify ?
Look for three consecutive Doji candles on your candlestick chart, reflecting a period of consolidation. - Is the 3 Doji pattern reliable?
While no pattern guarantees success, the 3 Doji pattern is highly regarded for its potential to signal market reversals when combined with other indicators.
For my contact:
You should first send me a friend request on MQL5, this will make it easier for me to connect and best support you with technical issues: https://www.mql5.com/en/users/tuanthang
– Join our Telegram Channel for new updating: https://t.me/forexeatradingchannel
– Recommended ECN Broker for EA – Tickmill: https://bit.ly/AdvancedTickmill
– Recommended Cent/Micro Account Broker for EA – Roboforex: https://bit.ly/AdvancedRoboforex
– To use an EA you need a VPS. Recommended VPS for EA – Chocoping: https://bit.ly/AdvancedVPS. When you open the account type in the discount code to get 5% off: THANGEA5
– If you want to ask me any question or join our private group chat for traders. Please contact me through Telegram: https://t.me/thangforex


