

Trading chart are the backbone of technical analysis in the financial markets, offering a visual representation of price movements over time. Whether you’re trading stocks, forex, commodities, or cryptocurrencies, understanding how to read and interpret trading charts is crucial for making informed decisions. This article delves into the world of trading charts, aiming to enhance your technical analysis skills and provide you with actionable insights for your trading strategy.
1. The Significance of Trading Charts
Trading chart are not just simple lines or bars drawn on a grid; they are a trader’s window into the market’s soul. They reflect the collective actions and sentiments of all market participants, turning raw data into a visual story. By analyzing these charts, traders can identify market trends, patterns, and potential turning points, enabling them to anticipate future price movements.
2. Types of Trading Charts
Before diving into chart analysis, it’s essential to understand the different types of trading charts:
- Line Charts: The simplest form, showing the closing prices over a set period. Ideal for a clear, uncluttered view of price movement.
- Bar Charts (OHLC): Provides more information than line charts, showing the opening, high, low, and closing prices for each period.
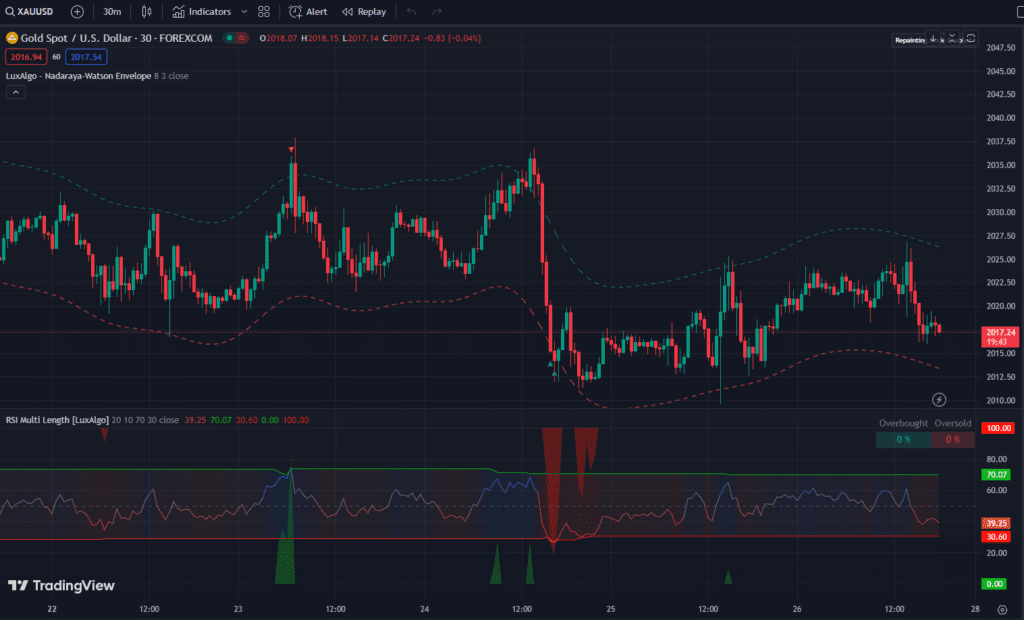
- Candlestick Charts: Similar to bar charts but visually more informative, offering insights into market sentiment and potential reversals.
- Heikin-Ashi Charts: A variation of candlestick charts, smoothing out price data to help identify trends more easily.
Each chart type offers unique insights, and the choice depends on your trading style and the specific analysis you wish to conduct.
3. Understanding Chart Patterns
Chart patterns are like the footprints of market psychology. Recognizing and understanding these patterns can give you a significant edge. Common patterns include:
- Trend Patterns: Ascending, descending, and symmetrical triangles that indicate the continuation of a trend.
- Reversal Patterns: Head and shoulders, double tops and bottoms, and inverse head and shoulders that signal a potential trend reversal.
- Consolidation Patterns: Flags, pennants, and wedges, indicating a pause in the trend before its continuation.
Mastering these patterns allows traders to predict potential market movements and make more informed trading decisions.
4. Utilizing Technical Indicators

Technical indicators are mathematical calculations based on historical price, volume, or open interest data. They provide additional insights and help confirm trends or reversals identified in chart patterns. Popular indicators include:
- Moving Averages: Indicate the average price over a specific period, helping to smooth out price action and identify trends.
- Momentum Indicators (RSI, MACD): Assess the speed of price movements, signaling overbought or oversold conditions.
- Volume Indicators (OBV, Volume Oscillator): Measure the strength of a trend based on volume changes.
While indicators can be incredibly useful, it’s crucial not to rely solely on them. They should complement your analysis, not replace it.
5. The Importance of Time Frames
Trading chart can be viewed in various time frames, from one minute to several years. Your choice of time frame should align with your trading style:
- Scalpers and Day Traders: Prefer shorter time frames (1-minute to 15-minute charts) for quick, in-and-out trades.
- Swing Traders: Often use intermediate time frames (1-hour to 4-hour charts) to capture larger market movements.
- Long-term Investors: Utilize longer time frames (daily to monthly charts) to analyze overarching trends.
The ability to analyze multiple time frames can provide a more comprehensive view of the market.
6. Practical Tips for Chart Analysis
- Keep It Simple: Start with a few key indicators and patterns. Overloading charts with too many tools can lead to confusion and analysis paralysis.
- Always Check for Confirmation: Use a combination of chart patterns, indicators, and other analysis tools to confirm potential trades.
- Stay Updated: Economic events, news, and market sentiment can all impact chart patterns and indicators. Stay informed to avoid unexpected surprises.
7. Continuous Learning and Adaptation
The markets are dynamic, and so should be your skills in technical analysis. Continuously educate yourself, backtest your strategies, and adapt to changing market conditions. Remember, the most successful traders are lifelong learners.
Conclusion
Trading chart are a fundamental tool in a trader’s arsenal, offering vital insights into market behavior. By understanding and effectively utilizing various chart types, patterns, and technical indicators, you can enhance your technical analysis skills. Combine this knowledge with a disciplined approach, continuous learning, and adaptation to evolving market conditions to pave your way to success in the trading world. Remember, while trading charts offer valuable insights, they are not a guarantee of success, and effective risk management should always be a cornerstone of your trading strategy.
For my contact:
You should first send me a friend request on MQL5, this will make it easier for me to connect and best support you with technical issues: https://www.mql5.com/en/users/tuanthang
– Join our Telegram Channel for new updating: https://t.me/forexeatradingchannel
– Recommended ECN Broker for EA – Tickmill: https://bit.ly/AdvancedTickmill
– Recommended Cent/Micro Account Broker for EA – Roboforex: https://bit.ly/AdvancedRoboforex
– To use an EA you need a VPS. Recommended VPS for EA – Chocoping: https://bit.ly/AdvancedVPS. When you open the account type in the discount code to get 5% off: THANGEA5
– If you want to ask me any question or join our private group chat for traders. Please contact me through Telegram: https://t.me/thangforex


