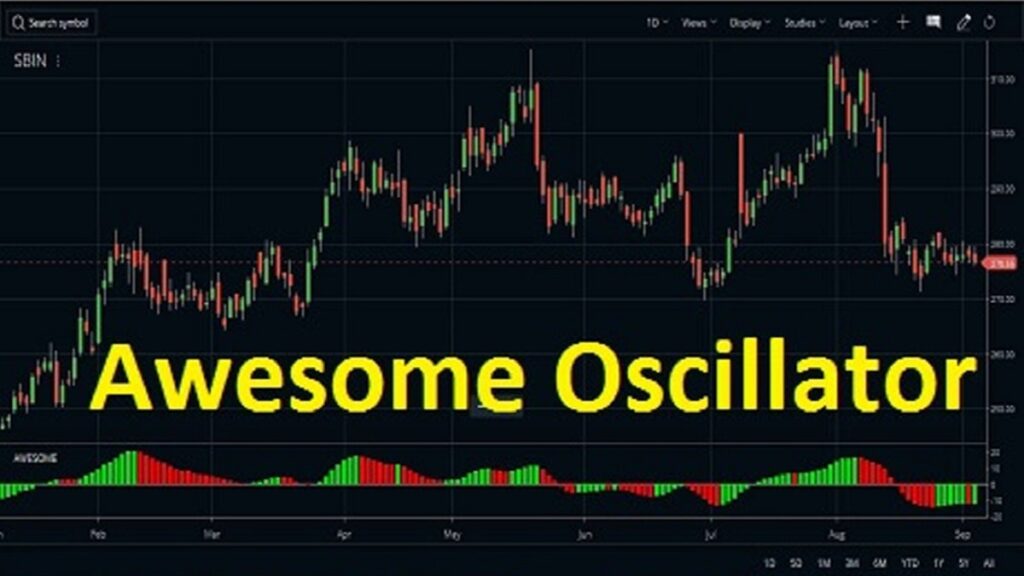
Discover the potential of the Awesome Oscillator Indicator (AO) to revolutionize your trading strategy. This powerful tool offers insights that can guide both novice and experienced traders toward better decision-making.
Unlocking Momentum with the Awesome Oscillator Indicator
The AO Indicator stands out by capturing market momentum. It aids in identifying the force behind price movements, enabling traders to predict potential trend continuations or reversals with greater accuracy.
Spotting Market Trends Early
In the financial markets, the ability to identify trends early is akin to having a crystal ball. Early detection offers traders a significant advantage, allowing for strategic positions to be taken ahead of the crowd. This guide focuses on methodologies and tools that can empower traders to recognize emerging trends, enhancing their decision-making process and potentially increasing profitability.


Understanding Market Trends
A market trend represents the general direction in which a market or a particular asset’s price is moving. Recognizing these trends early is crucial for traders looking to capitalize on movements before they become apparent to the majority.
Technical Analysis: The Foundation
Technical analysis remains the cornerstone of trend identification. By studying price charts and employing various technical indicators, traders can observe patterns and signals indicative of future movements.
- Moving Averages: Simple and exponential moving averages (SMAs and EMAs) can signal the beginning of a new trend when short-term averages cross over long-term averages.
- Trend Lines: Drawing trend lines on price charts helps identify directional market movements. A break above a downtrend line can indicate a shift towards an uptrend, and vice versa.
- Momentum Indicators: Tools like the Relative Strength Index (RSI) and the Moving Average Convergence Divergence (MACD) help gauge the strength of a trend and potential reversal points.
Volume as a Confirmation Tool
Volume analysis can confirm the validity of a potential trend. An uptrend accompanied by increasing volume suggests strong buying interest, making the trend more likely to sustain. Conversely, a downtrend with growing volume indicates selling pressure.
Sentiment Analysis: Gauging Market Mood
Sentiment analysis involves interpreting the mood and attitudes of market participants. High levels of optimism can precede upward trends, while pessimism may signal downtrends. Sentiment indicators and news analysis tools provide insights into market sentiment.
The Role of Economic Indicators
Economic indicators, such as GDP growth rates, employment data, and inflation figures, can have profound effects on market trends. Traders keeping an eye on these indicators can anticipate market movements initiated by economic changes.
Leveraging Technology for Edge
Advancements in technology, including artificial intelligence (AI) and machine learning, offer traders tools for analyzing vast amounts of data. These technologies can spot trends that might not be visible to the naked eye, providing a competitive edge.
Patience and Discipline: Key to Success
While tools and analyses can indicate potential trends, patience and discipline in executing trades are paramount. Jumping too early into what seems like an emerging trend without confirmation can lead to losses. Wait for multiple indicators to align before making a move.
Diving Into the Saucer Strategy
The Saucer Strategy is a notable technique in the world of trading, especially when applied in conjunction with indicators like the Awesome Oscillator. This approach is designed to identify subtle shifts in momentum that precede significant market movements, offering traders a unique advantage. Understanding and implementing the Saucer Strategy can significantly enhance decision-making processes in trading activities.


Understanding the Saucer Strategy
At its core, the Saucer Strategy is about recognizing patterns within a histogram—specifically, the Awesome Oscillator’s histogram—that resemble the shape of a saucer. These patterns signal potential reversals or continuations of trends, based on the gradual change in momentum they represent. The strategy hinges on the premise that market momentum shifts occur gradually and are detectible before they manifest in price movements.
Components of the Saucer Strategy
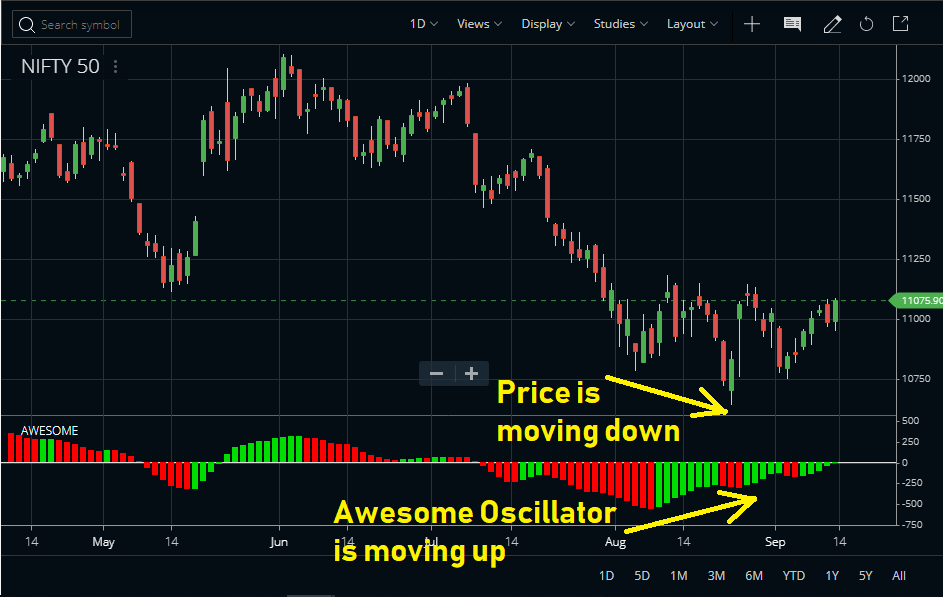
The strategy is primarily composed of three consecutive bars on the Awesome Oscillator histogram, each representing a period’s trading activity. The setup for a bullish saucer signal includes two red bars, followed by a green bar, where the second red bar is higher (less negative) than the first, indicating a slowing in downward momentum. A bearish setup is the mirror opposite, with two green bars followed by a red one, showing a decrease in upward momentum.
Application in Trading
To effectively apply the Saucer Strategy, traders need to follow a systematic approach:
- Indicator Setup: Ensure the Awesome Oscillator is correctly set up on your trading platform, displaying the histogram that’s essential for identifying saucer patterns.
- Pattern Recognition: Look for the saucer shape within the histogram. For a bullish signal, the pattern will form a concave up shape, suggesting that buying momentum is building. Conversely, a bearish saucer forms a concave down shape, indicating increasing selling pressure.
- Confirmation: It’s crucial to seek confirmation before acting on a saucer signal. This can come from other indicators, volume analysis, or a clear shift in price action. Confirmation helps mitigate the risk of false signals.
- Entry and Exit Points: Once a saucer signal is confirmed, traders can plan their entry. For a bullish saucer, the entry point is typically after the green bar that completes the pattern. For a bearish signal, it’s after the red bar. Exit points should be determined based on individual risk tolerance and goals, often using stop-loss orders to manage potential losses.
Advantages and Considerations
The Saucer Strategy is valued for its simplicity and effectiveness, particularly in spotting early signs of momentum shifts. However, like all trading strategies, it’s not foolproof. Its performance can be influenced by market conditions, and it’s most effective when combined with other analysis tools. Traders should also be aware of the potential for false signals, emphasizing the importance of confirmation and risk management practices.
FAQs
- How Does the Awesome Oscillator Indicator Work? It compares the momentum of a short and a long period, plotting the difference as a histogram.
- Can Beginners Use the Awesome Oscillator Indicator Effectively? Absolutely. Its straightforward signals make it accessible for traders at all levels.
- Is the AO Indicator Suitable for All Markets? Yes, the AO Indicator is versatile and can be applied across forex, stocks, commodities, and more.
For my contact:
You should first send me a friend request on MQL5, this will make it easier for me to connect and best support you with technical issues: https://www.mql5.com/en/users/tuanthang
– Join our Telegram Channel for new updating: https://t.me/forexeatradingchannel
– Recommended ECN Broker for EA – Tickmill: https://bit.ly/AdvancedTickmill
– Recommended Cent/Micro Account Broker for EA – Roboforex: https://bit.ly/AdvancedRoboforex
– To use an EA you need a VPS. Recommended VPS for EA
– Chocoping: https://bit.ly/AdvancedVPS. When you open the account type in the discount code to get 10% off: THANGEA10
– If you want to ask me any question or join our private group chat for traders. Please contact me through Telegram: https://t.me/thangforex


