

Understanding the Basics
In the ever-evolving world of trading, one chart pattern has consistently stood out for its reliability and predictability: the Double Top Pattern. This guide delves deep into the essence of the Double Top Pattern, unveiling its potential as the secret signal savvy traders have been capitalizing on.
The Double Top Pattern Unveiled
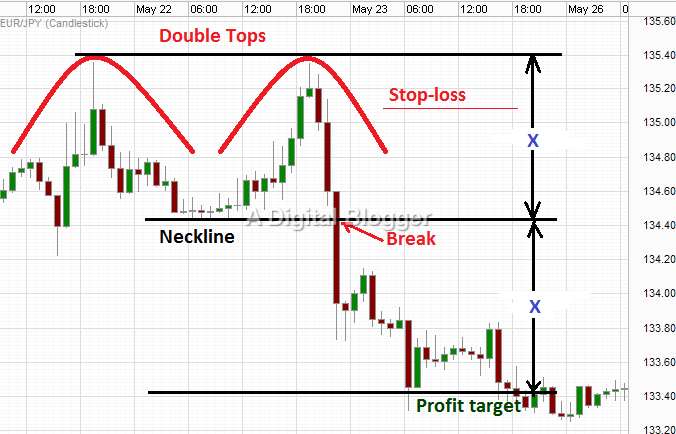
At its core, the Double Top Pattern is a reversal configuration that signals a shift from an uptrend to a downtrend. It is characterized by two distinct peaks at approximately the same level, which are separated by a trough, creating an “M” shape on the chart. This pattern is a herald of bearish reversals, presenting traders with an opportunity to adjust their strategies accordingly.
Identification and Execution
Recognizing a Double Top Pattern involves more than spotting two peaks. Critical to this process is identifying the neckline – the support level connecting the lowest points between the two peaks. A confirmed Double Top Pattern is marked by a subsequent break below this neckline, signaling traders to prepare for a potential sell-off.
Strategic Trading Tips
To leverage the Double Top Pattern effectively, traders should consider the following strategies:
- Patience is Key: Wait for the pattern to fully form and for the price to break below the neckline before executing any trades.
- Set Stop Losses Wisely: Placing stop losses just above the second peak can protect against unwanted losses if the market reverses unexpectedly.
- Profit Targets: Calculate your profit target by measuring the height of the pattern and extending that distance downward from the neckline break point.
Identifying Double Top Patterns
In the realm of trading and investment, mastering the art of chart pattern recognition can significantly enhance a trader’s ability to make informed decisions. Among these patterns, the Double Top Pattern stands out as a pivotal signal that savvy traders use to navigate the markets. This pattern, characterized by its ‘M’ shape on the chart, is a bearish reversal indicator that signals a potential shift from an uptrend to a downtrend. Recognizing this pattern early can be the key to successful trading decisions, but it requires a keen eye for detail and an understanding of certain critical elements.
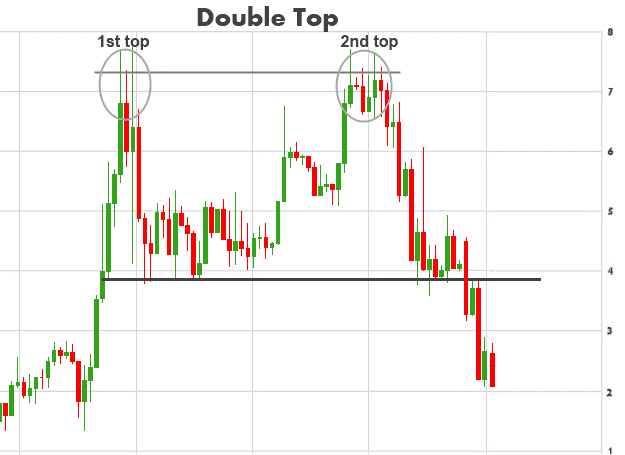
Spotting the Peaks
The first step in identifying a Double Top Pattern is to spot the two peaks that form the pattern’s distinctive ‘M’ shape. These peaks are typically of similar height, indicating a level where the price has struggled to break through twice, suggesting a strong resistance level. The area between these peaks is crucial; it’s called the ‘neckline,’ and how the price moves in relation to this line can provide significant insights into market sentiment.
Analyzing the Neckline
The neckline is a support level formed by connecting the lowest points immediately following the two peaks. A crucial indicator of a true Double Top Pattern is a break below this neckline after the formation of the second peak. This break is a strong signal that the bulls are losing control and that the bears are starting to dominate, potentially leading to a reversal in the price trend.
Volume and Confirmation
Volume plays a significant role in confirming the Double Top Pattern. Ideally, volume should increase on the rise to the first peak, decrease as the price dips and then rises again to form the second peak, and finally spike as the price breaks below the neckline. This increase in volume during the breakout is a strong confirmation that the pattern is valid and that the market sentiment has shifted.
Trading Strategies and Risk Management
Once a Double Top Pattern is identified, traders often consider it an opportune time to take short positions or sell their holdings to mitigate potential losses. However, it’s crucial to incorporate sound risk management strategies, such as setting stop-loss orders above the second peak to protect against unexpected market movements that could invalidate the pattern.
Market Implications
Understanding the Double Top Pattern is invaluable. It not only signifies a shift in market sentiment but also highlights areas of strong resistance. This insight allows traders to make informed decisions, whether it’s taking profits before a potential decline or entering short positions to leverage the market reversal.
FAQs
- What is a Double Top Pattern?
A technical analysis charting pattern indicating a reversal from an uptrend to a downtrend. - How do I recognize ?
Look for two consecutive peaks of similar height with a slight decline in between. - Why is the Double Top Pattern important for traders?
It signals a potential market reversal, providing an opportunity to adjust strategies accordingly.
For my contact:
You should first send me a friend request on MQL5, this will make it easier for me to connect and best support you with technical issues: https://www.mql5.com/en/users/tuanthang
– Join our Telegram Channel for new updating: https://t.me/forexeatradingchannel
– Recommended ECN Broker for EA – Tickmill: https://bit.ly/AdvancedTickmill
– Recommended Cent/Micro Account Broker for EA – Roboforex: https://bit.ly/AdvancedRoboforex
– To use an EA you need a VPS. Recommended VPS for EA
– Chocoping: https://bit.ly/AdvancedVPS. When you open the account type in the discount code to get 10% off: THANGEA10
– If you want to ask me any question or join our private group chat for traders. Please contact me through Telegram: https://t.me/thangforex


